- Scottish
- South African
- Italian
- Texan (Texas)
- Mexican
- Somerset
- Brummy
- Cockney
- German
- Swedish
- Chinese
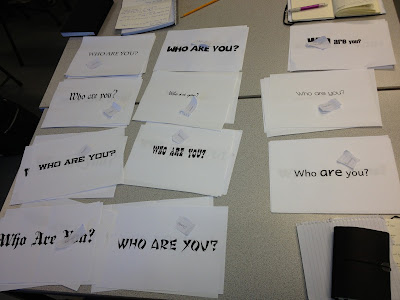
When set this task we were told that we were allowed to change the weight, the scale and the point size, we were allowed to use a range of fonts that we thought best represented the particular accent.
After collating me 11 a4 sheets of paper and taking them along with me to the session we were put in groups of four and assigned a new table to sit at which consisted of another groups (group of 4) set of 11 sheets of accents.
TASK 1:
The first task we were set was too separate each set of 11 accents into the categorises of accents (1-10) shown above. Whilst splitting these into 11 different piles we were also asked to make a list of some of the design decisions we made based on why we had chosen a particular font to be put in that particular category.
(Image from the first task we were set)
Design decisions when splitting the accents into different categories:
- Characteristics of the font based on whether it is a script, roman, gothic or block.
- Looking at the weight also effects our decisions, whether it is regular, bold, light or italic
- The point size of the words when spoken out loud.
TASK 2:
From the 11 piles we had made we were then asked to select the 3 piles which we thought were the most correct in terms of the selections we had made. Our group thought that the strongest accents fonts were:
Chinese
Findings from this task as a entire group:
International accents seem to be easier to distinguish a font for rather than regional accents in Britain, even if the majority of us have most likely visited the regional areas in comparison to the international locations where accents have derived from.
TASK 3:
Go to back to our own tables and rearrange what the previous groups have done into what each font is suppose to be in each accent categories, ending up with 11 piles of each accent.
This task was carried out to ultimately see how well the group who were distinguishing each accent did.
Notes from session:


No comments:
Post a Comment